8. Docker Observability: The Eyes and Ears of Your Microservices
Observability isn’t just “monitoring”; it’s the ability to understand what’s happening inside a container by looking at its external outputs.
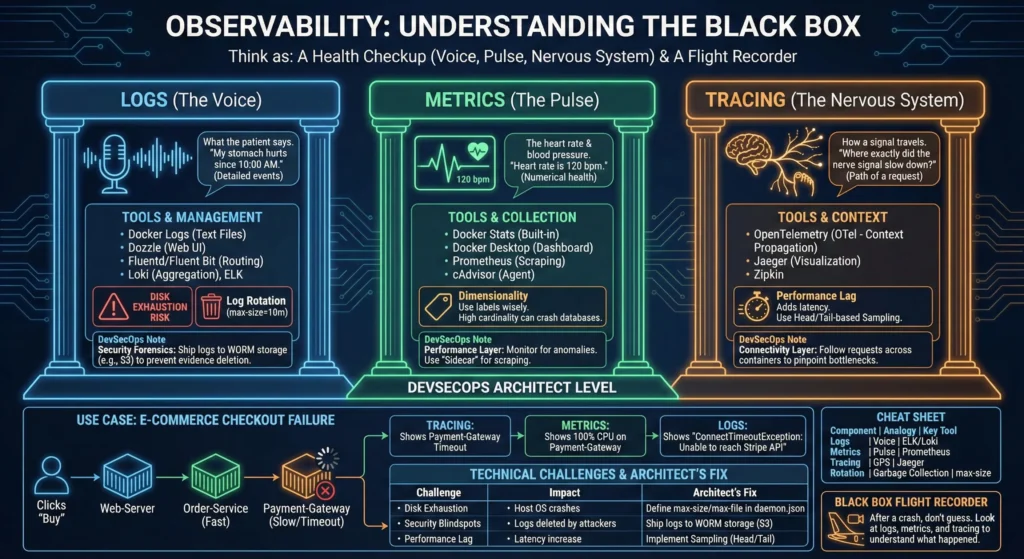
Think of it as a Health Checkup:
- Logs (The Voice): What the patient says. “My stomach hurts since 10:00 AM.” (Detailed events).
- Metrics (The Pulse): The heart rate and blood pressure. “Heart rate is 120 bpm.” (Numerical health).
- Tracing (The Nervous System): How a signal travels from the brain to the toe. “Where exactly did the nerve signal slow down?” (The path of a request).
If you are running a container, you need to know if it’s alive, if it’s working fast, and why it failed.
- Docker Logs: These are text files where the app writes its diary. If the app crashes, the logs tell you the “Last Words.”
- Tool: Dozzle – A simple web interface to see logs without using commands.
- Docker Stats: A built-in “Task Manager” for Docker.
- Tool: Docker Desktop – Provides a visual dashboard for resource usage.
- The Risk of “Infinite Talk”: If a container talks too much (too many logs), it can fill up your server’s hard drive and crash everything. This is why we use “Log Rotation” (deleting old logs automatically).
DevSecOps Architect Level
Architecting for observability requires a “Push vs. Pull” strategy and a focus on Security Forensics.
- Logging Strategy (The Forensics Layer)
- The Problem: Default
json-filelogs are local. If a container is deleted or a host is compromised, the “evidence” is gone. - The Solution: Use Logging Drivers.
- Fluentd/Fluent Bit: Acts as a traffic cop, routing logs to different places.
- Loki: A cost-effective log aggregation system inspired by Prometheus.
- Tools: Grafana Loki, Fluentd.
- The Problem: Default
- Metrics Strategy (The Performance Layer)
- Scraping: Docker metrics are usually pulled via a “Sidecar” or an agent like cAdvisor.
- Dimensionality: Use labels wisely. High cardinality (too many unique labels like
container_id) can crash your metrics database. - Tools: Prometheus, cAdvisor.
- Tracing Strategy (The Connectivity Layer)
- Context Propagation: Using OpenTelemetry (OTel) to inject IDs into headers so you can follow a request across 10 different containers.
- Tools: Jaeger, OpenTelemetry.
—
Use Case: E-Commerce Checkout Failure
Scenario: A customer clicks “Buy,” the spinner spins for 30 seconds, and it fails.
- Tracing: Shows the request went from Web-Server → Order-Service (Fast) → Payment-Gateway (Slow/Timeout).
- Metrics: Shows the Payment-Gateway container has 100% CPU usage.
- Logs: Shows an error:
ConnectTimeoutException: Unable to reach Stripe API.
—
Technical Challenges
| Challenge | Impact | Architect’s Fix |
| Disk Exhaustion | Host OS crashes due to log size. | Define max-size and max-file in daemon.json. |
| Security Blindspots | Attackers delete local logs to hide. | Ship logs to a Write-Once-Read-Many (WORM) storage like S3. |
| Performance Lag | Tracing every request adds 10ms latency. | Implement Head-based or Tail-based Sampling. |
—
Practical Lab: The “Auto-Cleaning” Observability Stack
Step 1: Secure Log Rotation
Create a container that generates logs but never exceeds 3MB.
docker run -d --name secure-logger \
  --log-opt max-size=1m \
  --log-opt max-file=3 \
  alpine sh -c "while true; do echo 'DevSecOpsGuru Security Log Event'; sleep 0.1; done"
Step 2: Deploy cAdvisor (The Visual Pulse)
docker run -d \
  --name=cadvisor \
  --privileged \
  --device=/dev/kmsg \
  -v /:/rootfs:ro -v /var/run:/var/run:ro -v /sys:/sys:ro \
  -v /var/lib/docker/:/var/lib/docker:ro \
  -p 8080:8080 \
  gcr.io/cadvisor/cadvisor
Access it at http://localhost:8080 to see real-time container performance.
—
Cheat Sheet
| Component | Analogy | Key Command/Config | Top Tool |
| Logs | Voice | docker logs -f <id> | ELK / Loki |
| Metrics | Pulse | docker stats | Prometheus |
| Tracing | GPS | OpenTelemetry SDK | Jaeger |
| Rotation | Garbage Collection | max-size=10m | Docker Daemon |
Think of Observability as the Black Box Flight Recorder in an airplane. After a crash, you don’t guess what happened; you look at the logs (cockpit voice), metrics (altitude/speed), and tracing (flight path).